Air quality
Taking appropriate measures to reduce air pollutants emitted by the airports run by the Zurich Airport Group is a constant undertaking.
Relevance
The air pollution arising at airports can be assigned to one of the following four source categories: aircraft, handling operations, airport infrastructure and landside traffic. Pollutants are primarily produced by the combustion of fuels such as kerosene, natural gas, heating oil, diesel or petrol. In addition, particulate matter is produced by tyre abrasion. Of these sources, aircraft account for the majority of emissions. The following pollutants are particularly relevant: nitrogen oxides (NOX), particulate matter (PM), volatile organic compounds (VOC) and carbon monoxide (CO).
Air pollution can be viewed from two different perspectives: firstly the quantity emitted at source ('emissions'), and secondly the concentration measured at a specific location ('pollution'). A complex interrelationship exists between emissions and pollution exposure: once discharged into the atmosphere, emissions do not remain in the same state – their composition changes, and they are diluted and dispersed before actively becoming pollutants.
At the Zurich site, Zurich Airport Ltd. provides complete and transparent information about the air pollution situation and takes steps to minimise its impact on the environment as far as possible.
Approach
Official annual nitrogen oxide emission limits are specified for Zurich Airport. To document compliance, Zurich Airport Ltd. maintains an emissions inventory which records how much of each individual pollutant is emitted annually. The company must also comply with emission limits specified for individual emission sources such as vehicles or heating furnaces.
National ambient air quality standards are also applicable. They are measured at certain locations and are also modelled over the area as a whole. Several monitoring stations have been set up across the airport and the surrounding region. Both fully automatic monitoring stations at Zurich Airport itself as well as passive samplers that measure the amount of the indicator pollutant nitrogen dioxide in the environment are used. The company is taking steps to reduce air pollutant emissions in all four source categories, not only the ones it produces itself, but also those produced by its airport partners.
Zurich Airport Ltd. has long levied emissions-based landing charges to encourage airlines to use low-emission aircraft. To further lower emissions, fixed ground power systems for supplying electrical power and air conditioning to aircraft are mandated at all gate parking stands. This results in far lower noise, CO2 emissions and pollution than when aircraft use their own auxiliary power units. Operational processes have also been optimised to minimise the amount of time aircraft spend queueing with their engines running. In ground handling, the gradual transition from combustion engines to electric-powered vehicles and machines is already well underway, not only at Zurich Airport Ltd. itself but also at its partners at Zurich Airport.
Where infrastructure is concerned, new and renovated buildings plus operational optimisation are helping to reduce the demand for fossil-based heating and consequently lower pollutant emissions. Zurich Airport is also taking steps to promote the use of public transport for travelling to and from the airport, for example by enabling inbound passengers to obtain tickets directly in the baggage claim hall, or by lobbying for more and earlier train services in the early morning for its shift workers. Zurich Airport Ltd. has also signed an agreement with the Zurich public transport network ZVV which allows not only the company itself, but all tenants in the Circle to offer their employees discounted public transport season tickets.
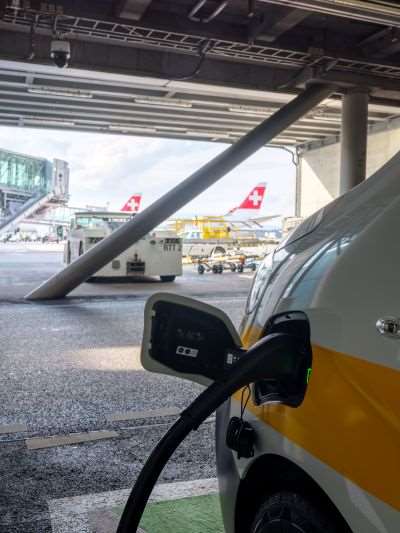
The number of electric vehicles is steadily increasing.
Zurich Airport Ltd. is furthermore helping to develop measurement methods and gain general insights into pollution at airports. The year under review saw the completion of the Aviator research programme to which the company had contributed measurements. Moreover, the prototype of a new type of instrument for measuring ultra-fine dust particles came into operation at Zurich Airport. As well as being more economic, it will also produce more reliable results in future.
Situation in the reporting year
As air traffic continued to recover after the Covid-19 pandemic, the figures for air pollutants also rose. The emission levels calculated are now just under the 2019 figures. The measured pollution values, on the other hand, where the airport is just one of a number of contributing sources, declined slightly compared with the previous year. This is due to meteorological conditions, primarily the direction and strength of the wind, which resulted in a lower pollution level in the reporting year.
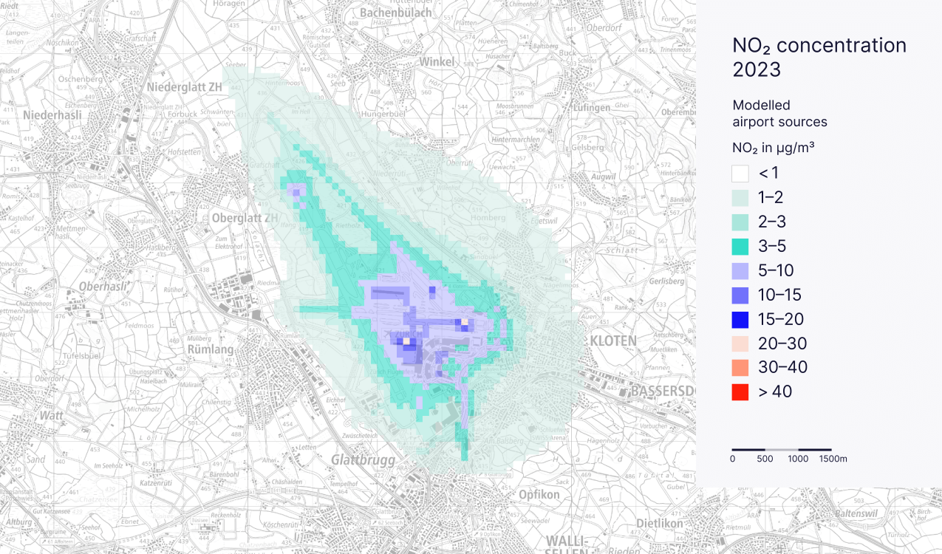
Zurich Airportʼs contribution to nitrogen dioxide pollution in the region
Monitoring of air pollution in Noida, India, where construction is well underway, continued during the reporting year. Periodic measurements at several locations indicated values below the local standards for all pollutants measured (including NO2, PM, CO, SO2).
As yet no information is available regarding the air pollution situation for the airports in Latin America. In Florianópolis, however, the company is planning to introduce a voluntary air pollution monitoring programme in the next few years.
Key data
Air quality
|
GRI 305 – 7; AO5 |
|
|
|
|
|
|
|
|
|
|
|
|
|
|
|
|
|
|
|
|
|
|
|
|
|
|
|
Zurich Airport, Switzerland |
|
Unit |
|
2019 |
|
2020 |
|
2021 |
|
2022 |
|
2023 |
|
NO x emissions |
|
Tonnes |
|
1,396 |
|
535 |
|
611 |
|
1,005 |
|
1,184 |
|
of which from aircraft 1) |
|
Tonnes |
|
1,293 2) |
|
469 |
|
539 |
|
929 |
|
1,098 |
|
of which from ground handling |
|
Tonnes |
|
42 |
|
19 |
|
22 |
|
32 |
|
31 |
|
of which from infrastructure |
|
Tonnes |
|
41 |
|
38 |
|
39 |
|
32 |
|
41 |
|
of which from landside traffic |
|
Tonnes |
|
20 |
|
9 |
|
11 |
|
12 |
|
13 |
|
VOC emissions |
|
Tonnes |
|
274 |
|
134 |
|
129 |
|
176 |
|
197 |
|
of which from aircraft |
|
Tonnes |
|
190 2) |
|
79 |
|
88 |
|
131 |
|
149 |
|
of which from ground handling |
|
Tonnes |
|
19 |
|
8 |
|
9 |
|
14 |
|
16 |
|
of which from infrastructure |
|
Tonnes |
|
55 |
|
42 |
|
27 |
|
25 |
|
24 |
|
of which from landside traffic |
|
Tonnes |
|
9 |
|
5 |
|
5 |
|
7 |
|
8 |
|
CO emissions |
|
Tonnes |
|
1,297 |
|
544 |
|
568 |
|
881 |
|
1,012 |
|
of which from aircraft |
|
Tonnes |
|
1,209 2) |
|
491 |
|
512 |
|
816 |
|
935 |
|
of which from ground handling |
|
Tonnes |
|
22 |
|
10 |
|
12 |
|
17 |
|
19 |
|
of which from infrastructure |
|
Tonnes |
|
17 |
|
14 |
|
15 |
|
12 |
|
14 |
|
of which from landside traffic |
|
Tonnes |
|
48 |
|
28 |
|
29 |
|
36 |
|
43 |
|
PM emissions |
|
Tonnes |
|
19 |
|
8 |
|
10 |
|
14 |
|
16 |
|
of which from aircraft |
|
Tonnes |
|
15 2) |
|
6 |
|
7 |
|
11 |
|
13 |
|
of which from ground handling |
|
Tonnes |
|
2 |
|
1 |
|
1 |
|
2 |
|
2 |
|
of which from infrastructure |
|
Tonnes |
|
2 |
|
1 |
|
2 |
|
1 |
|
1 |
|
of which from landside traffic |
|
Tonnes |
|
0 |
|
0 |
|
0 |
|
0 |
|
0 |
1) Flight operations in LTO cycle (up to 915 m), taking into account actual engine power, APU, engine start-up and airframe
2) Retroactive adjustment to the calculation method