Air quality
The Zurich Airport Group is a global leader in measuring and modelling air pollutants and implements measures on an ongoing basis to reduce the volume of air pollutants emitted.
Relevance
Air quality is one of Zurich Airport Ltd.’s core focus areas at the Zurich site. The air pollution arising at airports can generally be assigned to one of the following four source categories: aircraft, handling operations, airport infrastructure and landside traffic. Pollutants are primarily produced by the combustion of fuels such as kerosene, natural gas, heating oil, diesel or petrol. In addition, particulate matter is produced by tyre abrasion. Aircraft engines account for the majority of emissions. The following pollutants are particularly relevant: nitrogen oxides (NOX), particulate matter (PM), volatile organic compounds (VOC) and carbon monoxide (CO).
Air pollution can be viewed from two different perspectives: firstly the quantity emitted at source (‘emissions’), and secondly the quantity measured at a specific location (‘pollution’). A complex interrelationship exists between emissions and pollution exposure: once discharged into the atmosphere, emissions do not remain in the same state – their composition changes, and they are diluted and dispersed before actively becoming pollutants together with emissions from other sources.
Ensuring information is transparent and complete is important to Zurich Airport Ltd. It provides comprehensive information about the air pollution situation at the Zurich site and takes steps to minimise its impact on the environment as far as possible.
Approach
Official annual nitrogen oxide emission limits are specified for Zurich Airport. To document compliance, Zurich Airport Ltd. maintains an emissions inventory that records how much of each individual pollutant is emitted annually. The company must also comply with emission limits specified for individual emission sources such as vehicles or heating furnaces.
National ambient air quality standards are also applicable. They are measured at certain locations and are also modelled over the area as a whole. For this purpose, both a fully automatic measuring station and a passive collector, which measures the indicator pollutant nitrogen dioxide, are used at the airport. New, state-of-the-art measuring instruments for ultra-fine dust, i.e. particles smaller than 0.1 micrometers, were put into operation at the start of the reporting year. These instruments were developed together with an industrial partner to replace the existing measuring devices.
To reduce air pollutant emissions, Zurich Airport Ltd. takes measures in all four of the above-mentioned areas where the pollutants are produced. The measures have an impact not only on the company itself but also on its partners at the airport. Emission-based landing charges, already in place for a long time, encourage the use of lower-emission aircraft.
To further lower aircraft emissions, fixed ground power systems for supplying electrical power and air conditioning to aircraft are mandated at all gate parking stands at the Zurich site. This results in far lower pollutant emissions and also reduces noise and CO2 emissions compared to when aircraft use their own auxiliary power units. Operational processes have also been optimised to minimise the amount of time aircraft spend queueing with their engines running. In ground handling, the gradual transition from combustion engines to electric-powered vehicles and machines is already well under way, not only at Zurich Airport Ltd. itself but also at its partners.
Where infrastructure is concerned, new and renovated buildings plus operational optimisation are helping to reduce the demand for fossil-based heating and consequently lower pollutant emissions. Zurich Airport is also taking steps to promote the use of public transport for travelling to and from the airport, for example by lobbying for more and earlier train services in the early morning for its shift workers. Zurich Airport Ltd. has also signed an agreement with the Zurich public transport network ZVV, which allows not only the company itself but all Circle tenants to offer their employees discounted travel passes for public transport.
Situation in the reporting year
The higher figure for air traffic compared to the previous year has implications for air quality, with the emission levels calculated increasing. On the other hand, the measured pollution values, where the airport is only one of a number of contributing sources, was at the same level as the previous year. Air pollution did not also increase due to meteorological conditions, which resulted in a lower pollution level in the reporting year.
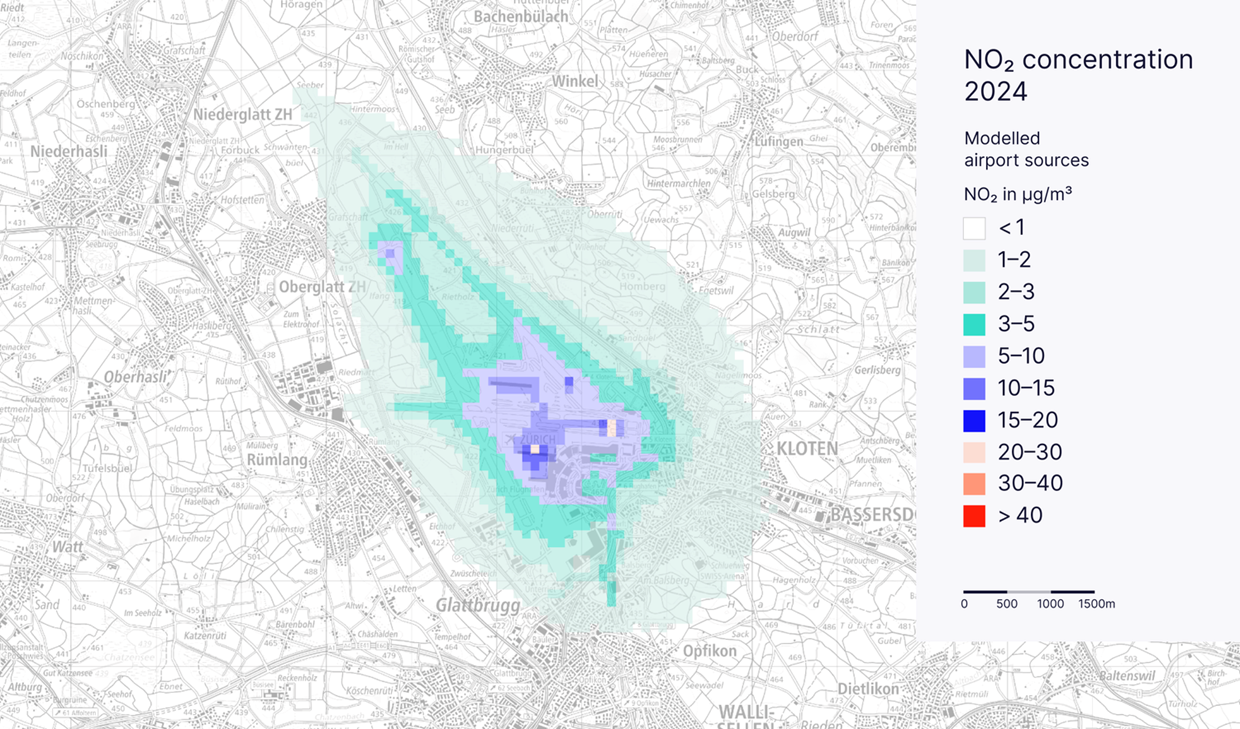
Zurich Airport’s contribution to nitrogen dioxide pollution in the region
Monitoring of air pollution in Noida, India, where construction is well under way, continued during the reporting year. Periodic measurements at several locations indicated values below the local standards for all pollutants measured (including NO2, PM, CO and SO2).
As yet, there is no permanent air pollutant monitoring in place at the sites in Latin America. Such a system is scheduled to be introduced at the sites in Brazil within the next few years. Preparatory work for this began in the reporting year.
Key data
Air quality
|
GRI 305 – 7; AO5 |
|
|
|
|
|
|
|
|
|
|
|
|
|
|
|
|
|
|
|
|
|
|
|
|
|
|
|
Zurich Airport, Switzerland |
|
Unit |
|
2020 |
|
2021 |
|
2022 |
|
2023 |
|
2024 |
|
NO x emissions |
|
Tonnes |
|
535 |
|
611 |
|
1,005 |
|
1,184 |
|
1,249 |
|
of which from aircraft 1) |
|
Tonnes |
|
469 |
|
539 |
|
929 |
|
1,098 |
|
1,169 |
|
of which from ground handling |
|
Tonnes |
|
19 |
|
22 |
|
32 |
|
31 |
|
28 |
|
of which from infrastructure |
|
Tonnes |
|
38 |
|
39 |
|
32 |
|
41 |
|
38 |
|
of which from landside traffic |
|
Tonnes |
|
9 |
|
11 |
|
12 |
|
13 |
|
15 |
|
VOC emissions |
|
Tonnes |
|
134 |
|
129 |
|
176 |
|
197 |
|
207 |
|
of which from aircraft |
|
Tonnes |
|
79 |
|
88 |
|
131 |
|
149 |
|
157 |
|
of which from ground handling |
|
Tonnes |
|
8 |
|
9 |
|
14 |
|
16 |
|
17 |
|
of which from infrastructure |
|
Tonnes |
|
42 |
|
27 |
|
25 |
|
24 |
|
25 |
|
of which from landside traffic |
|
Tonnes |
|
5 |
|
5 |
|
7 |
|
8 |
|
8 |
|
CO emissions |
|
Tonnes |
|
544 |
|
568 |
|
881 |
|
1,012 |
|
1,060 |
|
of which from aircraft |
|
Tonnes |
|
491 |
|
512 |
|
816 |
|
935 |
|
985 |
|
of which from ground handling |
|
Tonnes |
|
10 |
|
12 |
|
17 |
|
19 |
|
18 |
|
of which from infrastructure |
|
Tonnes |
|
14 |
|
15 |
|
12 |
|
14 |
|
17 |
|
of which from landside traffic |
|
Tonnes |
|
28 |
|
29 |
|
36 |
|
43 |
|
40 |
|
PM emissions |
|
Tonnes |
|
8 |
|
10 |
|
14 |
|
16 |
|
16 |
|
of which from aircraft |
|
Tonnes |
|
6 |
|
7 |
|
11 |
|
13 |
|
14 |
|
of which from ground handling |
|
Tonnes |
|
1 |
|
1 |
|
2 |
|
2 |
|
1 |
|
of which from infrastructure |
|
Tonnes |
|
1 |
|
2 |
|
1 |
|
1 |
|
1 |
|
of which from landside traffic |
|
Tonnes |
|
0 |
|
0 |
|
0 |
|
0 |
|
0 |
1) Flight operations in LTO cycle (up to 915 m), taking into account actual engine power, APU, engine start-up and airframe.