Energy and climate
Net zero by 2040: Zurich Airport Group's climate protection ambition.
Relevance
If the global rise in temperatures is to be halted, cutting greenhouse gas emissions and reducing them to zero as rapidly as possible is a matter of urgency. As far back as 1991 Flughafen Zürich AG began taking steps to reduce CO2 emissions at Zurich Airport. And despite expanding the infrastructure and doubling passenger numbers, it has succeeded in cutting these emissions by around one third since then. However, this is still not enough, which is why the Zurich Airport Group is aiming to reduce its greenhouse gas emissions to net zero by 2040.
Of the known greenhouse gases, only carbon dioxide (CO2) is emitted in any significant quantity at Zurich Airport. Each year, therefore, Flughafen Zürich AG records the CO2 emitted by each of its airports in an emissions inventory in accordance with the Greenhouse Gas Protocol. Other greenhouse gases, such as those emitted by refrigerants for example, are recorded as CO2 equivalents. All greenhouse gas sources are allocated to different spheres of influence known as “scopes”. Scope 1 comprises sources within the company. At Zurich Airport these mainly include heating systems, in-house electricity generation and the vehicle fleet. Scope 2 relates to emissions resulting from generation of the energy purchased from external suppliers. Finally, Scope 3 covers all other airport-related sources (e. g. ground handling and aircraft, including flights to the final destination) plus sources from upstream and downstream processes, for example in connection with landside access traffic, energy production or waste disposal. At over 99%, by far the majority of emissions arising at Zurich Airport as a whole fall into Scope 3.
The priority for the company is to reduce its own greenhouse gas emissions (Scopes 1 and 2). Flughafen Zürich AG will also actively encourage its airport partners to make significant cuts to their emissions as well (Scope 3). At the same time it is taking on the challenge of addressing the impacts of climate change and adapting its business model and infrastructure accordingly.
Climate protection is a global challenge. The majority-owned airports in Brazil and Chile are also recording their greenhouse gas emissions for Scopes 1 and 2. After its commissioning phase, the airport currently under construction in Noida, India is aiming to operate with net zero greenhouse gas emissions.
Approach and progress
Net zero by 2040
The Zurich Airport Group is endeavouring to reduce its energy demand and fossil fuel consumption as much as possible in order to lower associated greenhouse gas emissions. As emissions must be reduced as rapidly as possible, during the year under review the company further tightened up its previous target of achieving net zero by 2050. It is now aiming to achieve net zero from Scopes 1 and 2 by 2040. Net zero means that any remaining anthropogenic greenhouse gas emissions must be offset by removal of carbon from the atmosphere so that the balance is zero. In other words: those who continue emitting greenhouse gases must also ensure that they remove an equivalent amount from the atmosphere for a given period. As an interim target, the company is aiming to reduce its annual greenhouse gas emissions at Zurich Airport to just 20,000 tonnes by 2030. To help it meet these targets, the company has drawn up a reduction roadmap describing how it plans to gradually reduce its greenhouse gas emissions.
The biggest contributor to greenhouse gas emissions in Scope 1 at Zurich Airport is the airport's own combined heat and power generation plant which both produces electricity for the airport and distributes heat over a district heating grid. Although the plant is operated efficiently with natural gas or fuel oil, it nevertheless emits a considerable amount of greenhouse gases. Flughafen Zürich AG is therefore working on reducing the energy demand in its buildings. Each renovated building leads to lower energy demand thanks to better insulation, more efficient systems and new heating and cooling concepts. For instance, the new Dock A scheduled for construction from 2030 will make a major contribution to reducing greenhouse gas emissions. Numerous other measures planned for various buildings will also help to lower energy demand even further.
Alongside energy demand, the second focal point is generating renewable energy. The use of geothermal technology offers the greatest potential here. As many as twenty years ago, Flughafen Zürich AG began utilising geothermal technology in Dock E to meet the majority of the dock's heating and cooling energy requirements. Since then, further systems for supplying the Circle and parts of the maintenance complex have been added. During the reporting year, exploratory work also began on investigating the feasibility of using central underground geothermal storage. This has the potential to replace most of the fossil fuels currently used. Until then, the company plans to cut greenhouse gas emissions by purchasing a quantity of biogas, and subsequently synthetic gas, which will enable existing systems to be operated with far lower greenhouse gas emissions.
To meet its electricity needs, Flughafen Zürich AG purchases fossil-free grid electricity. It also generates some electricity in-house in its heating plant and from solar panels, more of which are continually being added.
Besides buildings, the second main source of emissions at the Zurich site are the company's vehicles. Many of the vehicles used today are already electric powered. The reduction roadmap outlines the full transition to electric vehicles, powered either by batteries or hydrogen. This transition is already underway, and the replacement of further vehicles such as passenger buses is also planned. The increasing number of battery-powered vehicles will necessitate further expansion of the charging infrastructure. The first airside rapid charging point came into operation during the year under review. Thanks to more flexible charging options, this will help to extend the range of uses for electric vehicles.
Airport Carbon Accreditation
Airport Carbon Accreditation (ACA) is a globally used and recognised programme of Airports Council International (ACI) which supports the climate protection aspirations of airports and certifies their progress. After being accredited at level three by this body since 2010, in the reporting year Zurich Airport succeeded in stepping up to the highest possible level – level four. As well as reducing greenhouse gases, this involves setting a target for achieving net zero greenhouse gas emissions from Scopes 1 and 2, specifying the respective reduction roadmap, and documenting active measures taken to motivate its partner companies at the airport to likewise reduce their emissions.
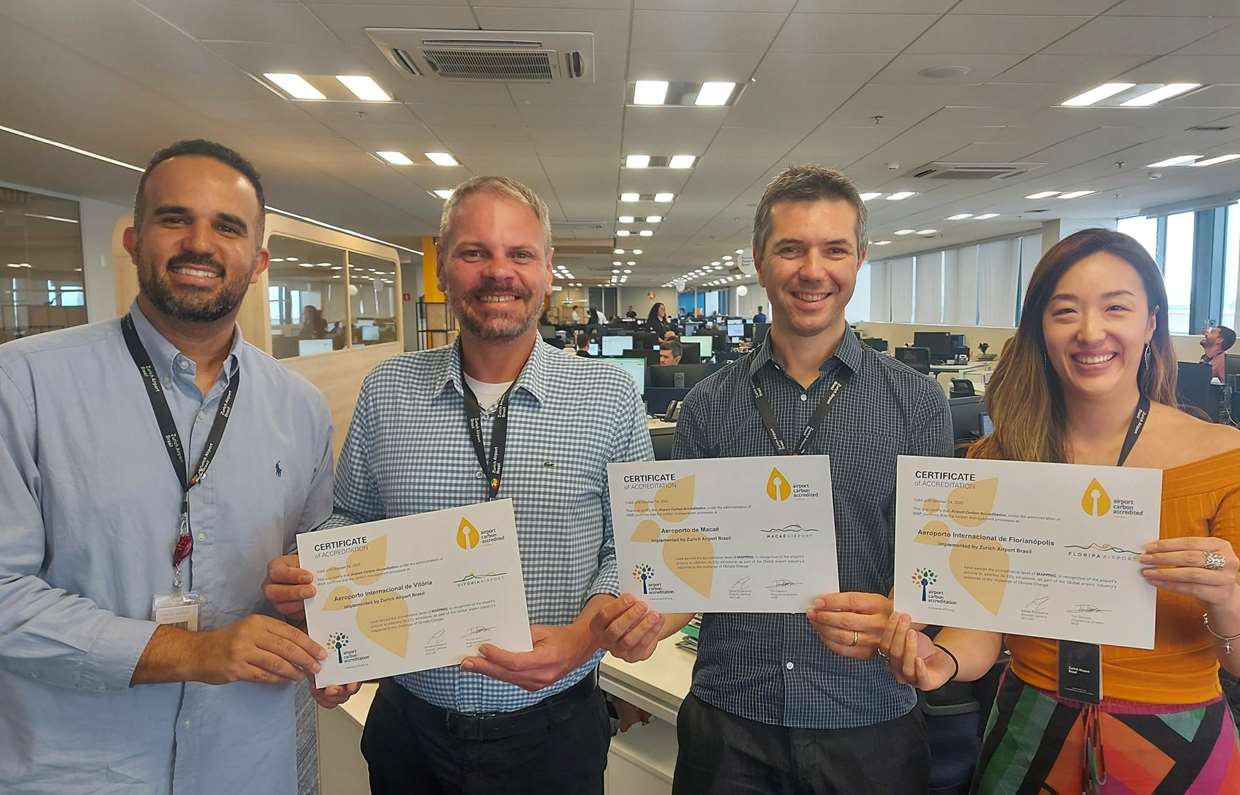
Accreditation at level 1 in Florianópolis, Vitória and Macaé
The three majority-owned subsidiaries in Brazil also signed up to ACA during the reporting year. The airports in Florianópolis, Vitória and Macaé were accredited at level one, which signifies they are recording all their greenhouse gas emissions. All three airports have also set themselves the goal of reaching the second level in 2023.
Large-scale consumers agreement
As a large-scale energy consumer, Flughafen Zürich AG has signed an agreement with the Building Department of the Canton of Zurich. This requires the company to make average annual efficiency savings of 2% until 2030, measured on the basis of the heated area of the airport and the number of user units (passengers, freight, other visitors). In return it is exempted from implementing some specific cantonal regulations. The target for specific energy consumption was met in the reporting period.
Energy and climate leader
Participation in the Swiss Confederation's “Exemplary Energy and Climate” initiative further underlines Flughafen Zürich AG's pioneering role in energy and climate protection. As part of this initiative it is implementing concrete measures to improve energy efficiency, to expand renewable energy sources and to reduce greenhouse gas emissions.
Sustainable fuels
In order to contribute to lowering aviation-related greenhouse gas emissions beyond the airport as well, Flughafen Zürich AG is committed to the use of sustainable aviation fuel (SAF). SAF is fuel made from biogenic waste or synthetically manufactured fuel, and over the course of its life cycle it produces at least 80% lower carbon emissions than fossil-based kerosene. Flughafen Zürich AG supports and encourages the use of SAF among its partners at Zurich Airport and in the rest of Switzerland, as well as at its other locations abroad.
Flughafen Zürich AG has itself signed an agreement with ETH spin-off Synhelion, a company that plans to use new technology to produce synthetic fuel at scale from water, CO2 and solar energy. This agreement commits Flughafen Zürich AG to purchasing fuel at cost price from a test facility, probably from some time in 2023, for use in its vehicles and machines at Zurich Airport.
Situation in the reporting year
Along with widely fluctuating prices, the great uncertainty surrounding the availability of fuel and electricity made the provision of energy to users during the reporting year extremely challenging. Flughafen Zürich AG did everything possible to balance the needs of operational continuity, cost and climate protection. It carefully scrutinised its operations to find ways of saving energy, and consequently identified many measures for reducing energy demand. Some were actioned immediately, for instance reducing the frequency of Skymetro, switching off lights and screens at night, and reducing the building temperature. Numerous other measures were documented in a catalogue so they can be triggered by the crisis team in the event of shortages.
There was therefore a slight decrease in the total energy requirement at Flughafen Zürich AG compared with the previous year. Whereas demand for electricity rose, it was possible to reduce the heating requirement, which depends greatly on the weather conditions. This is due, among other things, to the increased use of waste heat at the Circle so that virtually no heat from external sources had to be sourced.
The central heating plant at Flughafen Zürich AG, which produces most of the airport's heat, can be operated with both gas and heating oil. In the year under review, much less gas and more oil was used, which had a negative impact on CO2 emissions, as oil has a much larger emission factor than gas. Nevertheless, the CO2 emissions of the central heating plant were reduced overall. This was because, on the one hand, heating requirements were lower than average owing to the mild autumn and lack of a cold spell and, on the other, because the purchase of biogas made it possible to save 1365 tonnes of CO2. The greenhouse gas emissions of vehicles and machinery also declined slightly. Total greenhouse gas emissions in Scope 1 at Zurich Airport amounted to 29,043 tonnes in the reporting period, i.e. 10% lower than in the previous year. Emissions in Scope 2, of lesser importance compared with Scope 1, rose owing to the recovery in passenger volumes of 25% to 24 tonnes. Therefore, emissions in Scope 1 and 2 remained below the key threshold of 30,000 tonnes per year, the interim target for 2020. Owing to the substantial rise in traffic, the greenhouse gas emissions in Scope 3, determined primarily by emissions of aircraft en route to their destinations, reflected a sharp increase (+95%).
Key data
Greenhouse Gas Emissions (GRI 305 - 1, 305 - 2, 305 - 3)
|
Zurich Airport, Switzerland |
|
Unit |
|
2018 |
|
2019 |
|
2020 |
|
2021 |
|
2022 |
|
CO 2 e Scope 1 Flughafen Zürich AG |
|
Tonnes |
|
25,143 |
|
26,218 |
|
26,284 |
|
32,372 2) |
|
29,043 |
|
CO 2 e Scope 2 Flughafen Zürich AG |
|
Tonnes |
|
1,657 |
|
1,632 |
|
1,212 |
|
19 |
|
24 |
|
Total Scope 1 and 2 |
|
Tonnes |
|
26,799 |
|
27,850 |
|
27,496 |
|
32,390 |
|
29,067 |
|
CO 2 e Scope 3 at Zurich Airport 1) |
|
Tonnes |
|
4,122,020 2) |
|
4,230,902 2) |
|
1,518,548 2) |
|
1,643,396 2) |
|
3,243,356 |
|
|
|
|
|
|
|
|
|
|
|
|
|
|
|
Florianópolis Airport, Brazil |
|
Unit |
|
2018 |
|
2019 |
|
2020 |
|
2021 |
|
2022 |
|
CO 2 e Scope 1 |
|
Tonnes |
|
n/a |
|
n/a |
|
n/a |
|
285 2) |
|
907 |
|
CO 2 e Scope 2 |
|
Tonnes |
|
n/a |
|
n/a |
|
n/a |
|
946 2) |
|
138 |
|
Total Scope 1 and 2 |
|
Tonnes |
|
n/a |
|
n/a |
|
n/a |
|
1,232 2) |
|
1,045 |
|
|
|
|
|
|
|
|
|
|
|
|
|
|
|
Vitória/Macaé Airports, Brazil |
|
Unit |
|
2018 |
|
2019 |
|
2020 |
|
2021 |
|
2022 |
|
CO 2 e Scope 1 |
|
Tonnes |
|
n/a |
|
n/a |
|
n/a |
|
263 2) |
|
214 |
|
CO 2 e Scope 2 |
|
Tonnes |
|
n/a |
|
n/a |
|
n/a |
|
1,191 2) |
|
140 |
|
Total Scope 1 and 2 |
|
Tonnes |
|
n/a |
|
n/a |
|
n/a |
|
1,454 2) |
|
354 |
|
|
|
|
|
|
|
|
|
|
|
|
|
|
|
Antofagasta Airport, Chile |
|
Unit |
|
2018 |
|
2019 |
|
2020 |
|
2021 |
|
2022 |
|
CO 2 e Scope 1 |
|
Tonnes |
|
n/a |
|
n/a |
|
22 |
|
10 |
|
12 |
|
CO 2 e Scope 2 |
|
Tonnes |
|
n/a |
|
n/a |
|
458 2) |
|
452 2) |
|
446 |
|
Total Scope 1 and 2 |
|
Tonnes |
|
n/a |
|
n/a |
|
480 2) |
|
462 2) |
|
458 |
|
|
|
|
|
|
|
|
|
|
|
|
|
|
|
Iquique Airport, Chile |
|
Unit |
|
2018 |
|
2019 |
|
2020 |
|
2021 |
|
2022 |
|
CO 2 e Scope 1 |
|
Tonnes |
|
n/a |
|
n/a |
|
97 |
|
99 |
|
57 |
|
CO 2 e Scope 2 |
|
Tonnes |
|
n/a |
|
n/a |
|
328 2) |
|
350 2) |
|
541 |
|
Total Scope 1 and 2 |
|
Tonnes |
|
n/a |
|
n/a |
|
425 2) |
|
449 2) |
|
598 |
|
|
|
|
|
|
|
|
|
|
|
|
|
|
|
Noida Airport, India |
|
Unit |
|
2018 |
|
2019 |
|
2020 |
|
2021 |
|
2022 |
|
CO 2 e Scope 1 |
|
Tonnes |
|
n/a |
|
n/a |
|
n/a |
|
n/a |
|
31 |
|
CO 2 e Scope 2 |
|
Tonnes |
|
n/a |
|
n/a |
|
n/a |
|
n/a |
|
41 |
|
Total Scope 1 and 2 |
|
Tonnes |
|
n/a |
|
n/a |
|
n/a |
|
n/a |
|
73 |
Scope 1: In accordance with GHG Protocol: Flughafen Zürich AG’s own sources (vehicles, machinery, heating)
Scope 2: In accordance with GHG Protocol: externally sourced electricity for Flughafen Zürich AG
1) In accordance with GHG Protocol: aircraft in LTO cycle and full flight (outbound flight only), calculated by Eurocontrol, other emission sources at airport (ground handling, other heating) and all landside traffic from start to destination for all modes of transport
2) Retroactive correction
Energy (GRI 302 - 1, 302 - 2, 302 - 3, 302 - 4)
|
Zurich Airport, Switzerland |
|
Unit |
|
2018 |
|
2019 |
|
2020 |
|
2021 |
|
2022 |
|
Thermal energy |
|
MWh |
|
84,657 |
|
88,469 |
|
88,302 |
|
121,539 |
|
106,154 |
|
renewable |
|
MWh |
|
1,598 |
|
1,508 |
|
1,480 |
|
1,584 |
|
8,912 |
|
non-renewable |
|
MWh |
|
83,060 |
|
86,961 |
|
86,822 |
|
119,955 |
|
97,242 |
|
Fuels |
|
MWh |
|
5,935 |
|
6,110 |
|
3,662 |
|
4,922 |
|
4,799 |
|
renewable |
|
MWh |
|
0 |
|
0 |
|
0 |
|
0 |
|
0 |
|
non-renewable |
|
MWh |
|
5,935 |
|
6,110 |
|
3,662 |
|
4,922 |
|
4,799 |
|
Electricity |
|
MWh |
|
62,674 |
|
61,342 |
|
44,124 |
|
46,553 |
|
58,553 |
|
renewable |
|
MWh |
|
15,656 |
|
15,771 |
|
11,839 |
|
14,263 |
|
16,651 |
|
non-renewable |
|
MWh |
|
47,018 |
|
45,571 |
|
32,285 |
|
32,290 |
|
41,902 |
|
Total energy consumption (thermal energy, fuel, electricity) |
|
MWh |
|
153,267 |
|
155,921 |
|
136,088 |
|
173,014 |
|
169,506 |
|
Overall consumption primary energy 1) |
|
MWh |
|
498,026 |
|
497,595 |
|
411,709 |
|
457,774 |
|
505,205 |
|
Energy intensity ratio according to GVV 2) |
|
% |
|
84.7 |
|
84.2 |
|
94.8 |
|
114.3 3) |
|
106.2 |
|
|
|
|
|
|
|
|
|
|
|
|
|
|
|
Florianópolis Airport, Brazil |
|
Unit |
|
2018 |
|
2019 |
|
2020 |
|
2021 |
|
2022 |
|
Total fuel consumption |
|
MWh |
|
n/a |
|
n/a |
|
n/a |
|
252 |
|
5,440 |
|
Electricity consumption |
|
MWh |
|
n/a |
|
n/a |
|
9,420 |
|
7,464 |
|
3,293 |
|
Total energy consumption |
|
MWh |
|
n/a |
|
n/a |
|
9,420 |
|
7,716 |
|
8,733 |
|
|
|
|
|
|
|
|
|
|
|
|
|
|
|
Vitória/Macaé Airports, Brazil |
|
Unit |
|
2018 |
|
2019 |
|
2020 |
|
2021 |
|
2022 |
|
Total fuel consumption |
|
MWh |
|
n/a |
|
n/a |
|
n/a |
|
254 |
|
6,110 |
|
Electricity consumption |
|
MWh |
|
n/a |
|
n/a |
|
10,820 |
|
9,492 |
|
3,382 |
|
Total energy consumption |
|
MWh |
|
n/a |
|
n/a |
|
10,820 |
|
9,746 |
|
9,492 |
|
|
|
|
|
|
|
|
|
|
|
|
|
|
|
Antofagasta Airport, Chile |
|
Unit |
|
2018 |
|
2019 |
|
2020 |
|
2021 |
|
2022 |
|
Total fuel consumption |
|
MWh |
|
n/a |
|
n/a |
|
89 |
|
40 |
|
49 |
|
Electricity consumption |
|
MWh |
|
n/a |
|
n/a |
|
1,121 4) |
|
1,107 4) |
|
1,092 |
|
Total energy consumption |
|
MWh |
|
n/a |
|
n/a |
|
1,210 4) |
|
1,147 4) |
|
1,141 |
|
|
|
|
|
|
|
|
|
|
|
|
|
|
|
Iquique Airport, Chile |
|
Unit |
|
2018 |
|
2019 |
|
2020 |
|
2021 |
|
2022 |
|
Total fuel consumption |
|
MWh |
|
n/a |
|
n/a |
|
393 |
|
400 |
|
231 |
|
Electricity consumption |
|
MWh |
|
n/a |
|
n/a |
|
802 4) |
|
856 4) |
|
1,323 |
|
Total energy consumption |
|
MWh |
|
n/a |
|
n/a |
|
1,195 4) |
|
1,256 4) |
|
1,554 |
|
|
|
|
|
|
|
|
|
|
|
|
|
|
|
Noida Airport, India |
|
Unit |
|
2018 |
|
2019 |
|
2020 |
|
2021 |
|
2022 |
|
Total fuel consumption |
|
MWh |
|
n/a |
|
n/a |
|
n/a |
|
n/a |
|
117 |
|
Electricity consumption |
|
MWh |
|
n/a |
|
n/a |
|
n/a |
|
n/a |
|
51 |
|
Total energy consumption |
|
MWh |
|
n/a |
|
n/a |
|
n/a |
|
n/a |
|
168 |
1) Scope total airport excl. Fuel
2) Energy consumption measured in terms of energy reference area and user units
3) The target was raised to 109.5 owing to newly added buildings. The figure for 2021 was also corrected retroactively.
4) Retroactive correction