Air quality
The Zurich Airport Group works hard to reduce air pollution at its airports.
Relevance
A range of air pollutants from one of four different source categories are emitted at airports: aircraft, handling operations, airport infrastructure and landside traffic. Pollutants are primarily produced by the combustion of fossil fuels such as kerosene, natural gas, heating oil, diesel or petrol. In addition, particulate matter is produced by tyre abrasion. In comparison with the other sources, aircraft account for the majority of emissions.
Various air pollutants with different characteristics are emitted, but the following are particularly relevant: nitrogen oxides (NOX), particulate matter (PM), volatile organic compounds (VOC) and carbon monoxide (CO).
Air pollution can be viewed from two different perspectives: firstly the quantity emitted at source ('emissions'), and secondly the concentration measured at a specific location ('pollution'). A complex interrelationship exists between emissions and pollution: once discharged into the atmosphere, emissions do not remain in the same state – their composition changes, and they are diluted and dispersed before actively becoming pollutants.
Flughafen Zürich AG provides complete and transparent information about the air pollution situation and takes steps to minimise its impact on the environment as far as possible.
Approach
Official nitrogen oxide emission limits are specified for Zurich Airport. To document compliance, Flughafen Zürich AG maintains an emissions inventory which records how much of each individual pollutant is emitted annually. The company must also comply with emission limits specified for individual emission sources such as vehicles or heating furnaces.
National ambient air quality standards are also applicable. They are measured at certain locations and are also modelled over the area as a whole. Several monitoring stations have been set up across the airport and the surrounding region. Both fully automatic monitoring stations at Zurich Airport itself as well as passive samplers that measure the amount of the indicator pollutant nitrogen dioxide in the environment are used. The company is taking steps to reduce air pollutant emissions in all four source categories, not only the ones it produces itself, but also those produced by its airport partners.
Flughafen Zürich AG has long levied emissions-based landing charges to encourage airlines to use low-emission aircraft. Fixed ground power systems to supply electrical power and air conditioning to aircraft are mandated at all gate parking stands. This results in far lower noise, CO2 and pollutant emissions than if aircraft were to use their own auxiliary power units. Operational processes have also been optimised to minimise the amount of time aircraft spend queueing with their engines running. In ground handling, the transition from combustion engines to electric-powered vehicles and equipment is already well underway. Where infrastructure is concerned, new and renovated buildings plus operating optimisation are helping to reduce the demand for fossil-based heating and consequently lower pollutant emissions. Zurich Airport is also taking a number of steps to encourage people to use public transport for travelling to and from the airport, hence reducing private car transport.
The recovery in the number of flight movements was also reflected in the air pollution situation. Compared with the previous year, emissions of air pollutants at Zurich Airport have increased and are around 30% below the figures from before the Covid-19 pandemic. Pollution was generally somewhat lower than the long-term average. However, the annual average for nitrogen dioxide exceeded the limit, as had been the case prior to the pandemic. Today it is known that the air pollution caused directly by airports is only significant within a very narrow radius. At Zurich Airport, residential areas are affected by pollution exposure only to a limited extent.

Zurich Airport has excellent connections to the public transport network
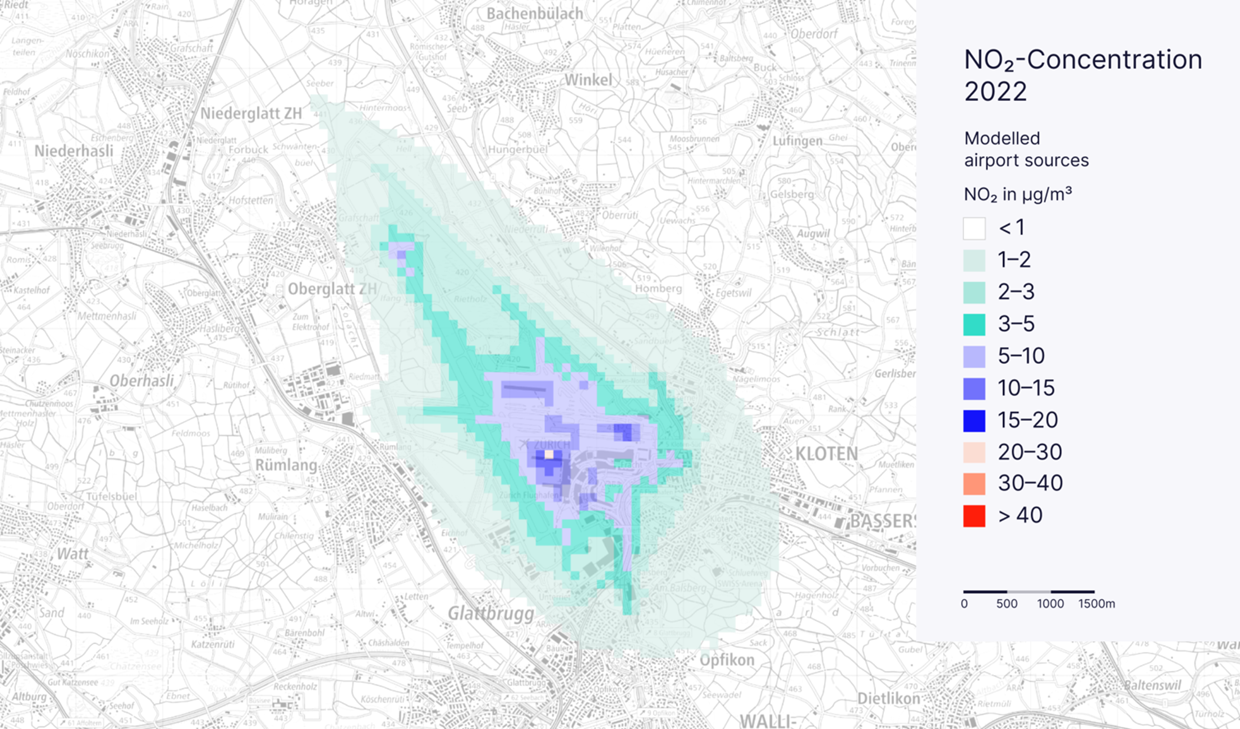
Zurich Airport's contribution to nitrogen dioxide pollution in the region.
Once construction work began, air pollution monitoring also commenced in Noida, India during the reporting year. Periodic measurements at two locations on the project site indicated values below the local limit values for all pollutants measured (including NO2, PM, CO, SO2).
As yet no information regarding the air pollution situation is available for the airports in Latin America. In Florianópolis, however, the company is planning to introduce an air pollution monitoring programme in the coming years.
Key data
|
Air quality at Zurich Airport (Zurich site), GRI 305 – 7 |
|
Unit |
|
2018 |
|
2019 |
|
2020 |
|
2021 |
|
2022 |
|
NO x emissions |
|
Tonnes |
|
1,381 |
|
1,396 |
|
535 |
|
611 |
|
1,005 |
|
of which from aircraft 1) |
|
Tonnes |
|
1,273 2) |
|
1,293 2) |
|
469 |
|
539 |
|
929 |
|
of which from ground handling |
|
Tonnes |
|
46 |
|
42 |
|
19 |
|
22 |
|
32 |
|
of which from infrastructure |
|
Tonnes |
|
40 |
|
41 |
|
38 |
|
39 |
|
32 |
|
of which from landside traffic |
|
Tonnes |
|
22 |
|
20 |
|
9 |
|
11 |
|
12 |
|
VOC emissions |
|
Tonnes |
|
284 |
|
274 |
|
134 |
|
129 |
|
176 |
|
of which from aircraft |
|
Tonnes |
|
205 2) |
|
190 2) |
|
79 |
|
88 |
|
131 |
|
of which from ground handling |
|
Tonnes |
|
20 |
|
19 |
|
8 |
|
9 |
|
14 |
|
of which from infrastructure |
|
Tonnes |
|
50 |
|
55 |
|
42 |
|
27 |
|
25 |
|
of which from landside traffic |
|
Tonnes |
|
10 |
|
9 |
|
5 |
|
5 |
|
7 |
|
CO emissions |
|
Tonnes |
|
1,360 |
|
1,297 |
|
544 |
|
568 |
|
881 |
|
of which from aircraft |
|
Tonnes |
|
1,267 2) |
|
1,209 2) |
|
491 |
|
512 |
|
816 |
|
of which from ground handling |
|
Tonnes |
|
23 |
|
22 |
|
10 |
|
12 |
|
17 |
|
of which from infrastructure |
|
Tonnes |
|
18 |
|
17 |
|
14 |
|
15 |
|
12 |
|
of which from landside traffic |
|
Tonnes |
|
52 |
|
48 |
|
28 |
|
29 |
|
36 |
|
PM emissions |
|
Tonnes |
|
21 |
|
19 |
|
8 |
|
10 |
|
14 |
|
of which from aircraft |
|
Tonnes |
|
16 2) |
|
15 2) |
|
6 |
|
7 |
|
11 |
|
of which from ground handling |
|
Tonnes |
|
2 |
|
2 |
|
1 |
|
1 |
|
2 |
|
of which from infrastructure |
|
Tonnes |
|
2 |
|
2 |
|
1 |
|
2 |
|
1 |
|
of which from landside traffic |
|
Tonnes |
|
0 |
|
0 |
|
0 |
|
0 |
|
0 |
1) Flight operations in LTO cycle (up to 915 m), taking into account actual engine power, APU, engine start-up and airframe
2) Retroactive adjustment to the calculation method